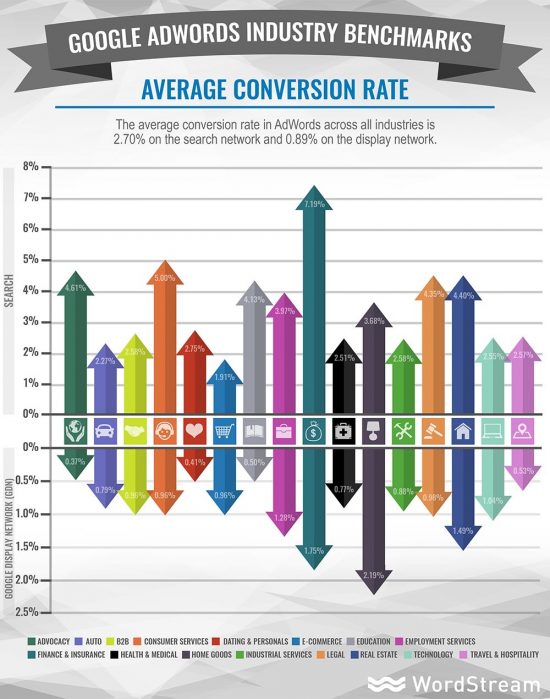
The chart gives information on conversion rates in AdWords from AdWords management platform – Wordstream. If you are looking for paid search marketing, this chart will surely give you an idea of the conversion rates while making a business strategy. The different tests show you the rates that are very specific to the markets, the type of the keywords and the proposition.
 The above chart is published by Wordstream. The report is based on the US based Wordstream client accounts in different verticals; the total research was conducted with a sample of 2,367 clients. The different verticals represented a total of $34.4 million in the total Adwords Spend that were advertising on Google Adwords Search and Display networks in the Q2 2015. The different sectors covered includes Auto, Advocacy, B2B, Consumer Services, E-Commerce, Finance and Insurance, Employment services, Education, Dating and Personals, Health and Medical, Industrial services, Home Goods, Real Estate, Legal, Travel & Hospitality, Technology.
Conversion Averages for previous AdWords conversion rate data
All the results are true averages, the summary of previous recordings is stated below:
- Average conversion rate for search network in Q3 2012 was 5.63%
- Average conversion rate from display network in Q3 2012 was 4.68%
- Travel Industry had the lowest conversion rates
- Internet/Telecoms have highest conversion rates for search and display
- Display networks generate 5 times the volume of impressions but only 1/5 of the clicks compared to search network.
- According to Wordstream, it suggested an average of 2% to 5% paid search clickthrough rates for competitive industries and 5% click through rate for non-competitive industries slotting for top positions.


